Sharpe Ratio Explained: The Metric That Separates Good Strategies From Great Ones
Learn what the Sharpe Ratio is, how to find it in TradingView, and why it's the key to evaluating any trading strategy.

You could have two trading strategies that make the exact same return, start with the same capital, and run over the same time period — and one of them could be a ticking time bomb while the other is a strategy you can scale, automate, and build a real trading business around. The difference? The Sharpe Ratio — and most traders either ignore it or don't fully understand it.
If you've ever judged a strategy purely by how much money it made, this article will change how you evaluate your trades going forward.
Sharpe Ratio Explained On YouTube
Table of Contents
- What Is the Sharpe Ratio?
- Why Final Profit Isn't Enough
- The Sharpe Ratio Formula (Simplified)
- What Is a Good Sharpe Ratio?
- Backtesting and the Overfitting Problem
- How to Find Your Sharpe Ratio in TradingView
- How to Calculate It From Your Own Trade Data
- Using the Sharpe Ratio the Right Way
- FAQ
- Conclusion
Key Takeaways
- The Sharpe Ratio measures return per unit of risk — not just raw profit.
- Two strategies with identical returns can have very different risk profiles; the Sharpe Ratio reveals which is actually better.
- A Sharpe Ratio below 1 is generally poor; 1–2 is solid; 2–3 is strong; 3+ is rare in live trading.
- High Sharpe Ratios in backtests may reflect overfitting, not real edge.
- TradingView shows the Sharpe Ratio in the strategy tester's performance summary; you can also calculate it manually via Excel or an AI tool like ChatGPT.
- Use it as one piece of the puzzle, not the only metric you evaluate.
What Is the Sharpe Ratio?
At its core, the Sharpe Ratio measures how much return you're earning relative to how much risk — or volatility — you're taking on to get it. A simpler way to think about it: how much are you getting paid for how chaotic your trading strategy is?
It was developed by Nobel laureate William F. Sharpe and has become one of the most widely used metrics in finance for evaluating the efficiency of an investment or strategy.
The formula itself might look intimidating at first glance, but the concept is straightforward:
- Return = how much your strategy made
- Risk = how much your returns fluctuate (standard deviation)
- Sharpe Ratio = how efficient the relationship between those two things is
If two strategies produce the same return over the same period, the one with less volatility and fewer wild swings will always have the higher Sharpe Ratio. That's the whole point.
Why Final Profit Isn't Enough
For a long time, most traders — including experienced ones — default to judging a strategy by one thing: how much money it made. If Strategy A returned $1,000 and Strategy B returned $200 over the same period, Strategy A wins, right?
Not necessarily.
What raw return doesn't show you is:
- How much drawdown did you experience? Was it a brutal 60% max drawdown, or a manageable 10%?
- How consistent were the returns? Did the equity curve look like a roller coaster, or a steady upward slope?
- Could you actually stick with this strategy in real life? A strategy with massive swings might look great on paper but cause you to abandon it after one bad week.
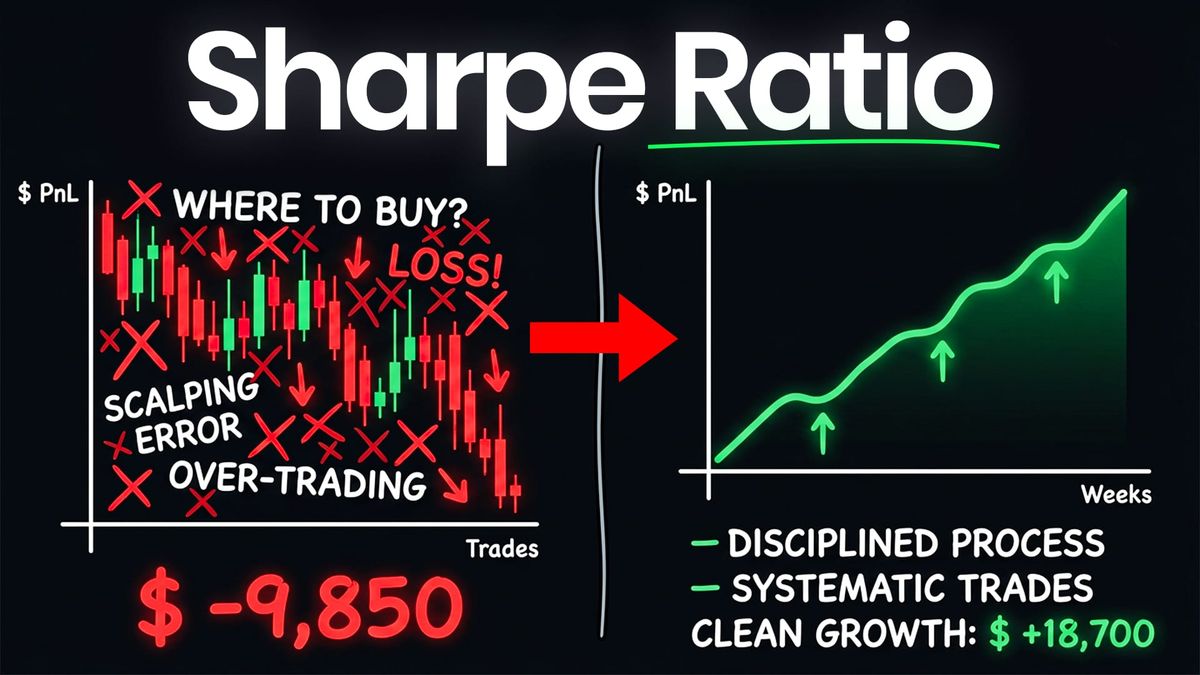
Imagine two equity curves that both end at a 50% gain. Strategy A is all over the place — surging up, crashing down, recovering, crashing again. Strategy B is slow and steady with smaller, more predictable fluctuations. Same final number, completely different experience.
Ask yourself honestly: which strategy would you actually scale? Which one would you increase your position size on over time? Which one would you trust enough to automate?
That's the real-world problem the Sharpe Ratio solves. It rewards consistency, not just final profit.
The Sharpe Ratio Formula (Simplified)
Without diving into the full mathematical notation, here's the practical breakdown:
Sharpe Ratio = (Portfolio Return − Risk-Free Rate) ÷ Standard Deviation of Returns
- Portfolio Return: Your strategy's average return over a given period.
- Risk-Free Rate: Typically the return on something like a Treasury bill — a baseline for "safe" returns. In many trading contexts, this is set to zero for simplicity.
- Standard Deviation of Returns: A measure of how much your returns vary. Higher standard deviation = more volatility = more chaos.
The result is a single number that tells you how efficiently your strategy converts risk into reward.
What Is a Good Sharpe Ratio?
Here's a practical rule of thumb:
| Sharpe Ratio | What It Means |
|---|---|
| Below 1.0 | Generally not great — the risk isn't being compensated well |
| 1.0 – 2.0 | Solid — a respectable, tradeable strategy |
| 2.0 – 3.0 | Strong — this is where you want to be |
| 3.0+ | Rare in live trading — treat with healthy skepticism |
A Sharpe Ratio of 3 or higher might show up in a backtest, but realizing that kind of efficiency in actual live trading is uncommon. Which brings us to one of the biggest pitfalls traders run into.
Backtesting and the Overfitting Problem
Backtests love high Sharpe Ratios — and that's precisely why you need to be careful.
When you're building a strategy and refining it against historical data, it becomes very easy to overfit — essentially tailoring your strategy to perform perfectly on data that has already happened. The more you tweak and optimize, the better the backtest looks. But that performance often falls apart the moment market conditions change.
A backtest optimized to the past isn't predicting the future; it's memorizing it.
So if you're running a backtest and seeing a Sharpe Ratio of 4 or 5, that's a red flag worth investigating, not a reason to celebrate. Always take a high backtested Sharpe Ratio with a grain of salt, especially if:
- The strategy has been heavily parameter-optimized
- The sample period is short
- You haven't accounted for fees and slippage
How to Find Your Sharpe Ratio in TradingView
If you're already using TradingView to backtest, finding your Sharpe Ratio is straightforward.
- Open TradingView and navigate to the Strategy Tester.
- Load the strategy you want to evaluate and set your time frame.
- Scroll down to the Performance Summary section — you'll see total P&L, drawdown, total trades, profitable trades, and profit factor.
- Continue scrolling to the Risk-Adjusted Performance section. Your Sharpe Ratio will appear there.
As a real example: a strategy might look impressive at a glance — solid total P&L, decent trade count — but reveal a Sharpe Ratio of just 0.17 when you dig into the risk-adjusted section. That number tells you the volatility of returns is roughly five times larger than the average return. In other words, the strategy is producing a lot of noise for not much signal.
TradingView also provides a benchmark comparison showing the buy-and-hold return for the asset. This gives useful context, though it's not always an apples-to-apples comparison depending on how your strategy is sized or what instrument you're trading.
Note on TradingView Plans: Basic backtesting is available on free plans, but deep historical backtesting typically requires a premium plan. If you're planning to upgrade, Black Friday tends to offer the best discounts.
How to Calculate It From Your Own Trade Data
TradingView lets you download your backtest results as an Excel file directly from the strategy tester. Once you have that file, you have a few options:
Option 1: Calculate it in Excel
Use the raw trade data to calculate average return, standard deviation, and plug them into the formula manually. This gives you full control and transparency.
Option 2: Use Python
For more advanced users, Python is a powerful option. You can import the Excel file, manipulate the data, and run more sophisticated analysis beyond just the Sharpe Ratio.
Option 3: Use ChatGPT
The easiest route for most traders. Download the Excel file, upload it to ChatGPT, and ask it to calculate the Sharpe Ratio from the data. It will return a number quickly — though keep in mind this may calculate on a per-trade basis, which is a slightly different methodology than TradingView's built-in calculation. Both are valid; just be consistent in how you compare.
Using the Sharpe Ratio the Right Way
The Sharpe Ratio is a powerful tool, but it works best as part of a broader evaluation — not as a standalone verdict.
Where it really shines: head-to-head comparisons.
If you're testing two similar strategies — say, one trading ES futures and one trading NQ futures — and they're using comparable sizing and trading frequency, the Sharpe Ratio becomes an excellent tiebreaker. It gives you an objective, quantitative way to ask: which of these is doing more with less chaos?
Where you need to be careful:
- Small sample sizes: Don't evaluate a Sharpe Ratio calculated on 10 trades. That's not a statistically meaningful sample. The more trade data you have, the more reliable the number.
- Comparing unlike strategies: A day trading strategy and a swing trading strategy will naturally produce different Sharpe Ratios. So will strategies on different asset classes — crypto, futures, equities, gold. Comparing them directly doesn't tell you much.
- Ignoring fees and slippage: Always include realistic transaction costs in your backtest. Ignoring them inflates performance and makes your Sharpe Ratio look better than it will be in live trading.
The Sharpe Ratio doesn't tell you whether a strategy is profitable. It tells you whether the profit is worth the ride. Use it alongside other metrics — max drawdown, profit factor, win rate, trade frequency — to build a complete picture.
FAQ
What does the Sharpe Ratio actually measure?
It measures return per unit of risk — specifically, how much return a strategy generates relative to its volatility. A higher ratio means you're getting more return for the same level of risk.
What is considered a good Sharpe Ratio for trading?
A ratio between 1 and 2 is generally considered solid. Between 2 and 3 is strong. Anything above 3 is rare in live trading and should be scrutinized for overfitting if it appears in a backtest.
Can I find the Sharpe Ratio inside TradingView?
Yes. Open the Strategy Tester, run your backtest, and scroll down to the Risk-Adjusted Performance section in the performance summary. The Sharpe Ratio will be listed there.
Why do backtests often show higher Sharpe Ratios than live trading?
Because it's easy to overfit a strategy to historical data. When you optimize a strategy to perform well on past data, the Sharpe Ratio looks great — but those parameters often don't hold up when market conditions change.
Is a low Sharpe Ratio always a dealbreaker?
Not necessarily. Context matters. A strategy that returns 25% with a max drawdown of just 3.27% might have a low Sharpe Ratio due to frequent small trades, but it could still be a solid strategy. Use it comparatively — especially when evaluating similar strategies side by side.
How is the Sharpe Ratio different from profit factor?
Profit factor is the ratio of gross profit to gross loss and measures how much you make versus how much you lose overall. The Sharpe Ratio specifically focuses on the consistency and volatility of returns — two strategies can have the same profit factor but very different Sharpe Ratios.
Does trading frequency affect the Sharpe Ratio?
Yes. Strategies that trade frequently with smaller, fluctuating returns can naturally produce lower Sharpe Ratios. This doesn't mean the strategy is bad — it means the metric needs to be interpreted in context.
Should I use the Sharpe Ratio as my only evaluation metric?
No. It's one piece of a larger puzzle. Combine it with drawdown analysis, profit factor, win rate, and trade sample size for a complete picture of strategy quality.
Conclusion
The Sharpe Ratio won't tell you everything about a trading strategy — but it will tell you something most traders overlook: whether the returns you're generating are actually worth the volatility you're taking on to get them.
Two strategies, same return, same time period. Without the Sharpe Ratio, they look identical. With it, you can see which one is worth scaling and which one will shake you out at the first sign of turbulence.
Start incorporating it into your evaluation process — whether you're reading it directly in TradingView's strategy tester, calculating it from exported trade data in Excel, or running it through ChatGPT. The more context you build around your strategies, the better your long-term decision-making will be.
If you want to go deeper and track your Sharpe Ratio alongside the rest of your trading data in one place, tools like Tradezella are worth exploring.