I Tested TradeZella's AI Backtesting (Honest Review)
I ran three strategies through TradeZella's AI backtesting. Here's what it got right, where it fell short, and how to get a real result.

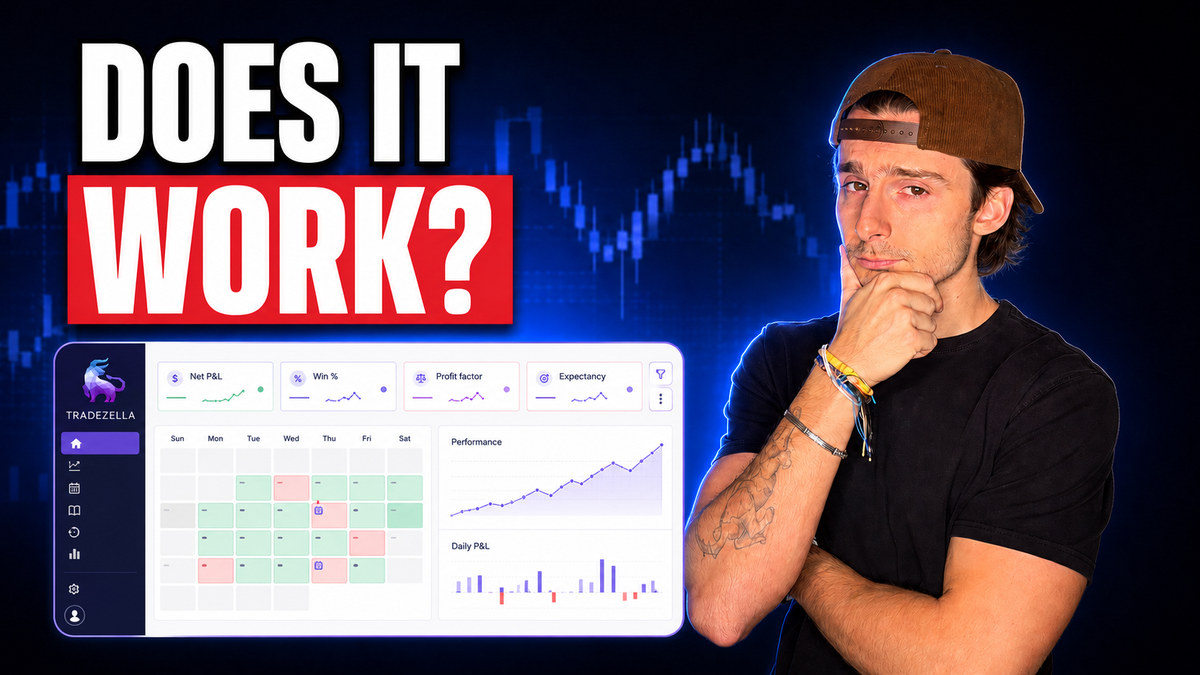
TradeZella just launched an automated backtesting feature, and the pitch is genuinely appealing: describe your strategy in plain English and let Zella AI run hundreds of trades for you — no code, no Pine Script, no manual bar-by-bar clicking.
So I put TradeZella AI backtesting through three real strategies to see whether it actually delivers. A daily SMA crossover, an intraday EMA crossover, and then an iteration on the second one to see how the tool handles refinement.
Short answer: it's a legitimately useful addition, and the trade log alone justifies a lot of it. But it's not a perfect replica of how your strategy trades, generations take real time, and getting a usable result depends heavily on how well you prompt it.
Here's exactly what happened on all three tests, what the AI got right, where it fell short, and how to actually get value out of it.
Table of Contents
- What Is TradeZella's AI Backtesting?
- How the Automated Backtest Actually Works
- Test One: SMA Crossover on SPXL
- Test Two: Intraday EMA Crossover on MES
- Test Three: Iterating With a Modified Prompt
- The Trade Log Is the Standout Feature
- The Honest Verdict
- How to Get the Most Out of It
- Frequently Asked Questions
- The Bottom Line
Key Takeaways
- You describe the strategy in plain words and the engine runs it — no coding required.
- The AI asks clarifying questions about profit targets, exit rules, date ranges and starting capital before it runs anything.
- It flags conflicting rules before running, which is arguably the most valuable part of the whole feature.
- Test one produced only 7 trades on a daily SPXL crossover — statistically useless, but a fast lesson in strategy selection.
- Test two ran 176 trades on an intraday MES EMA crossover and was marginally profitable with one brutal drawdown month.
- Removing the short side improved results — 192 trades, 1.2 profit factor, roughly $1.6K P&L.
- The written AI analysis gives actionable adjustments, not just statistics.
- The trade log is the best part — click any trade and see entry, exit, target and stop plotted on the chart.
- It's approximate, not exact. You're effectively vibe coding a strategy, so verify a sample of trades manually.
- Generations take time, especially over longer historical ranges.
What Is TradeZella's AI Backtesting?
TradeZella has been a trade journaling and analytics platform for years. The new backtesting feature extends it into strategy validation — testing an idea against historical data before you commit live money to it.
When you create a new session you get two paths:
- Backtest on your own — the manual process, where you step through charts yourself
- Automated backtest — the AI version, where you describe the strategy and Zella AI runs hundreds of trades on your behalf
This review covers the automated path. There are templates available if you want a starting point, plus an example prompt to show you the expected format, and an Add button for specifying symbols, sessions, periods and more granular controls.
The core value proposition is straightforward: get a real read on your strategy before you fund it. That's a meaningful thing to have, and historically it required either coding skill or a lot of tedious manual work.
How the Automated Backtest Actually Works
The workflow is conversational, which is both its strength and its limitation.
Describing Your Strategy in Plain English
You type out what you want in normal language. Here's the exact prompt used for the first test:
Go long when the 50 SMA crosses the 200 SMA on the SPXL daily chart. Only long. Stop out when the SMA crosses back below. Enter and exit morning after daily close occurs.
That's not a highly detailed prompt — deliberately so, to see how the engine handles gaps. There's also a "Have Zella enhance it" option that will improve your prompt for you before running, which I left off for this test.
SPXL, for context, is a 3x leveraged S&P 500 ETF. For a momentum strategy it makes reasonable sense as a test vehicle, though futures or any other instrument work fine too.
The Clarifying Questions
Before running anything, the engine comes back asking for what's missing. In this case it wanted a profit target, offering options like 2:1 or 1:1 risk-reward.
That's when the gap in my own prompt became obvious — I never specified a take profit at all. The AI catching that is genuinely useful; it's the kind of omission that quietly invalidates a backtest.
The full set of parameters specified before the run:
| Parameter | Value |
|---|---|
| Profit target | 2:1 risk-reward |
| Start date | January 1, 2010 |
| End date | Present |
| Session | New York |
| Starting capital | $10,000 |
It then asked one more question: should the trade exit only when the 50 crosses back below the 200, or should it also close early at a fixed stop level? I chose crossover-only.
The Conflict Warnings Are the Best Feature
This is where the tool proved it's doing more than pattern-matching a prompt. Before running, it flagged that parts of the strategy would be simplified — that the engine couldn't faithfully execute certain pieces and would approximate or skip them.
Specifically, it identified that two of my exit rules directly conflicted:
- Exiting on the 50 SMA crossing back below the 200 means holding until the death cross, regardless of profit
- A 2R take profit would close the trade earlier
Its resolution: the engine would honor whichever triggered first, and if I intended crossover-only, I should remove the 2R take profit.
It also flagged that "enter and exit morning after" requires entering at the open of the next trading day following the signal, and that fill simulation may vary slightly from real-world execution.
That's exactly the kind of disclosure you want. A backtester that silently resolves ambiguity in your prompt is far more dangerous than one that tells you where it had to guess.
Test One: SMA Crossover on SPXL
The results came back fast, with the conflict warning attached.
| Metric | Result |
|---|---|
| Win rate | 57.1% |
| Total trades | 7 |
| Net P&L | $40 |
A 57% win rate sounds fine until you see the sample size. Seven trades over roughly fifteen years tells you essentially nothing statistically — a golden-cross strategy on a daily chart simply doesn't fire often enough to validate this way.
That's not a failure of the tool. It's the tool doing its job and revealing that the strategy design was the problem. Which is exactly what a backtest is supposed to do before you risk capital on it.
So I pivoted to something with a real sample size.
Test Two: Intraday EMA Crossover on MES
The second strategy traded intraday on MES using a fast EMA crossover:
- Long when the 5 EMA crosses above the 20 EMA on a 5-minute chart
- Short when the 5 EMA crosses below the 20 EMA
- 1.5R take profit
This time the engine returned 176 trades and a modestly profitable result. Not spectacular, but profitable — and with enough trades to actually mean something.
Reading the Equity Curve
The curve told a much more interesting story than the headline number.
The strategy looked genuinely strong for most of the tested period. Then in late March it got destroyed — a single sharp, sustained drawdown that erased most of the accumulated gains.
Since late March it has been slightly positive, but nowhere near enough to recover that damage.
Here's how I read that: the edge decayed recently, but it was real before. That's a very different conclusion from "this strategy doesn't work." Something is there — the question is what changed and whether the rules can adapt. That distinction is only visible because the equity curve is plotted rather than reduced to a summary statistic.
What the AI Analysis Told Me
Alongside the stats, TradeZella generates a written trading analysis. Its verdict on this strategy was "tentatively positive, but fragile" — noting that longs were outperforming shorts and that drawdown was not terrible.
Then it gave a specific, actionable suggestion. Paraphrasing its point: the EMA crossover exit is the core of the risk management, because it cuts losses before they mature into full stops. Without it, the backtest holds trades longer than the rules intend. The real strategy likely has shorter holds and smaller average losses, which could shift the profit factor meaningfully in either direction — so rerun with the early crossover exit implemented before judging the edge.
That's the difference between a backtester and an analyst. It's not just handing you a win rate; it's telling you why the number in front of you might be misleading and what to change before you trust it.
Test Three: Iterating With a Modified Prompt
There's a "Run again with a modified prompt" button, which is where the workflow really clicks. Since the analysis noted longs were outperforming shorts, I made one change: no shorts. Long-only.
| Metric | Test two (long + short) | Test three (long only) |
|---|---|---|
| Total trades | 176 | 192 |
| Profit factor | — | 1.2 |
| Net P&L | Marginally positive | ~$1,600 |
A better result across the board. Not spectacular — a 1.2 profit factor is thin — but a clear improvement from a single-word change to the prompt.
Worth noting: the trade count went up after removing the short side, from 176 to 192. There may have been other adjustments applied in the rerun, which is a reminder that the engine is interpreting your intent rather than executing literal code.
The updated Zella analysis flagged a single month down $643 as a significant drag on the results — again pointing straight at the specific thing worth investigating rather than leaving you to find it.
The Trade Log Is the Standout Feature
If one thing sells this feature, it's this.
The trade log lists every trade the engine took. Click any individual trade and it opens up into a chart view where you can:
- Pull up the timeframe the trade occurred on
- See the entry and exactly where it filled
- See the exit
- See the target and where the stop loss sat
Being able to visually confirm how a trade actually played out is enormously more useful than a row in a spreadsheet. Scroll through a handful of trades and you develop a fast intuitive sense of what needs adjusting — whether stops need moving, whether the risk-reward is wrong, whether entries are consistently early or late.
It takes time to go through. But it's the fastest route from "here are my stats" to "here's what I actually need to fix."
The Honest Verdict
After three tests, here's the balanced assessment.
What It Does Well
- No coding required. Describe the strategy in plain words and it runs. That removes the single biggest barrier to systematic validation for most traders.
- It flags conflicts before running. Telling you where your rules contradict each other is genuinely valuable and uncommon.
- The written analysis is actionable. It identifies what to change, not just what happened.
- The trade log visualization is excellent. Entry, exit, target and stop plotted on the actual chart.
- Iteration is fast. Modify the prompt, rerun, compare. That loop is where the real work happens.
- It surfaces the right questions about profit targets and exit logic that you may not have thought through.
Where It Falls Short
- Generations take time, and the further back you test or the more data you request, the longer you wait.
- It's an approximation, not an exact replica. You're effectively vibe coding a strategy — telling it what you want rather than defining it precisely.
- Less precise than actual code. With Pine Script on TradingView, the logic is explicit and more visual. Here you're trusting an interpretation of your description.
- It won't always catch your intent perfectly, whether the strategy is highly detailed or unusually simple.
- Rerun results can shift in unexpected ways, as the jump from 176 to 192 trades after removing shorts illustrates.
The fair framing: this is a strong first release of a hard feature, and it will almost certainly improve. But go in understanding it's an approximation engine, not a compiler.
How to Get the Most Out of It
Based on running three strategies through it, here's what actually matters:
- Write a detailed prompt. Vague input produces vague output. Specify entry, exit, timeframe, direction, target and stop explicitly rather than making the engine guess.
- Read the conflict warnings carefully. When it tells you two rules contradict, fix the prompt rather than accepting whichever triggers first.
- Check your sample size before drawing conclusions. Seven trades is not a result. If your strategy doesn't fire often enough, test it on a shorter timeframe or accept that this method can't validate it.
- Look at the equity curve, not just the summary. A profitable strategy with one catastrophic month is a very different thing than a steadily profitable one.
- Review individual trades across different periods. Pull trades from different months, different weeks, and different market conditions. Confirm the engine is executing what you actually intended — because if it isn't, the entire result is worthless.
- Use the modified-prompt rerun deliberately. Change one variable at a time so you can attribute the difference in results.
- Budget the time. This is not a thirty-second process if you want a trustworthy answer.
Frequently Asked Questions
What is TradeZella's AI backtesting feature?
An automated backtesting tool where you describe a trading strategy in plain English and Zella AI runs it against historical data — often hundreds of trades — returning full statistics, an equity curve, a written analysis, and a clickable trade log. No coding required.
Do I need to know how to code to use it?
No. That's the entire point. You describe entries, exits, timeframe and targets in normal language. It's the main advantage over writing Pine Script or a coded backtest.
How accurate is the AI backtesting?
It's an approximation rather than an exact replica. The engine interprets your description, and it explicitly warns that fill simulation may vary from real-world execution. Review a sample of individual trades to confirm it's executing your intent.
Can I backtest futures with TradeZella?
Yes. The second and third tests in this review ran on MES, the micro E-mini S&P 500 contract. ETFs like SPXL work as well, and you can specify the symbol, session, date range and starting capital.
How far back can I backtest?
The first test in this review ran from January 1, 2010 to the present. Longer historical ranges take noticeably more time to generate.
Does it tell you how to improve your strategy?
Yes. Alongside the statistics you get a written analysis assessing the strategy's condition — one test came back "tentatively positive, but fragile" — plus specific suggested adjustments and a recommendation on what to rerun before judging the edge.
Can I rerun a backtest with changes?
Yes. There's a run-again-with-a-modified-prompt option. In this review, changing a strategy to long-only improved the profit factor to 1.2 across 192 trades.
What is the trade log?
A complete list of every trade the backtest took. Clicking any trade opens a chart view showing the entry, exit, take profit target and stop loss location, so you can visually verify how each trade played out.
Is TradeZella's AI backtesting worth it?
For traders who want to validate an idea without coding it, yes — provided you're willing to invest the time in detailed prompts and manual trade review. It's a strong addition to an already useful platform, not a replacement for understanding your own strategy.
Is there a TradeZella discount code?
Yes — the code TC20 saves 20%.
The Bottom Line
TradeZella's AI backtesting is a real addition to the platform, not a gimmick. Being able to describe a strategy in plain words and get back hundreds of simulated trades, an equity curve, a written analysis and a fully clickable trade log is legitimately valuable — especially for traders who were never going to write code for this.
It has clear limits. Generations are slow on long ranges, it won't always capture your exact intent, and it's an interpretation rather than a precise implementation. If you want exact logic, coded backtesting still wins on precision.
But the workflow it enables — prompt, run, read the analysis, adjust, rerun — is how strategy development actually should work. And the conflict warnings that tell you where your own rules contradict each other are worth the price of admission on their own.
The one thing that determines whether it's useful to you: are you willing to put in a detailed prompt and then actually review the trades? Pull a sample from different months, different weeks, different market conditions, and confirm the strategy is executing the way you intended. If it isn't, no statistic on the results page means anything.
Do that work and this becomes a genuinely powerful validation tool. If you want to test it on your own strategy, you can try TradeZella here — the code TC20 takes 20% off. I've been using the platform for a couple of years, and this is one more feature that makes the whole toolkit more useful.
Watch the full video review here: